Tempest at a Traffic Light: Using Crowd-Sourced Data to Return Travel Times to Normal Following Massive Storm Damage
Challenge
Due to a powerful weather event, 40% of the 1,500 signals in the City of Dallas failed, causing a 92% increase in travel times along a major arterial.
Solution
Quantifying storm impacts using crowd-sourced, probe-based data provided insight and enabled the City to measure the impacts of the weather event.
Impact
The City used a data-driven approach to return signals to operation, a task that normally would have been impractical, if not impossible.
The Challenge
Dallas, Texas was hit with an unusual microburst, taking out traffic signals throughout the city and leaving drivers stuck in traffic on a nine-mile stretch of congested roadway.
In June 2019, Dallas was hit by a microburst—a weather phenomenon with 70mph winds that dropped three inches of rain in just 45 minutes—which troubled residents, even those accustomed to Dallas’s unpredictable weather patterns. The storm uprooted trees, knocked down powerlines, and took out 600 of the City’s 1,500 signals.
The next morning, drivers found themselves stuck on a nine-mile stretch of Preston Road, a typically busy six-lane major arterial with an average daily traffic volume of 60,000 vehicles per day. This section of Preston Road includes 31 signalized intersections, which are usually coordinated to provide signal progression. On that day, it was exceptionally congested. Signals were out and debris was strewn across the road. What do you do when a snap storm leaves you stranded in traffic and late for work? If you’re a traffic engineer, you crunch the numbers to understand which traffic signal delays held you up.
Our Solution
Looking to quantify the delay, we used crowd-sourced probe-based data to measure travel times at the precise date and time of the trip and quantify the storm’s impact on travel times.
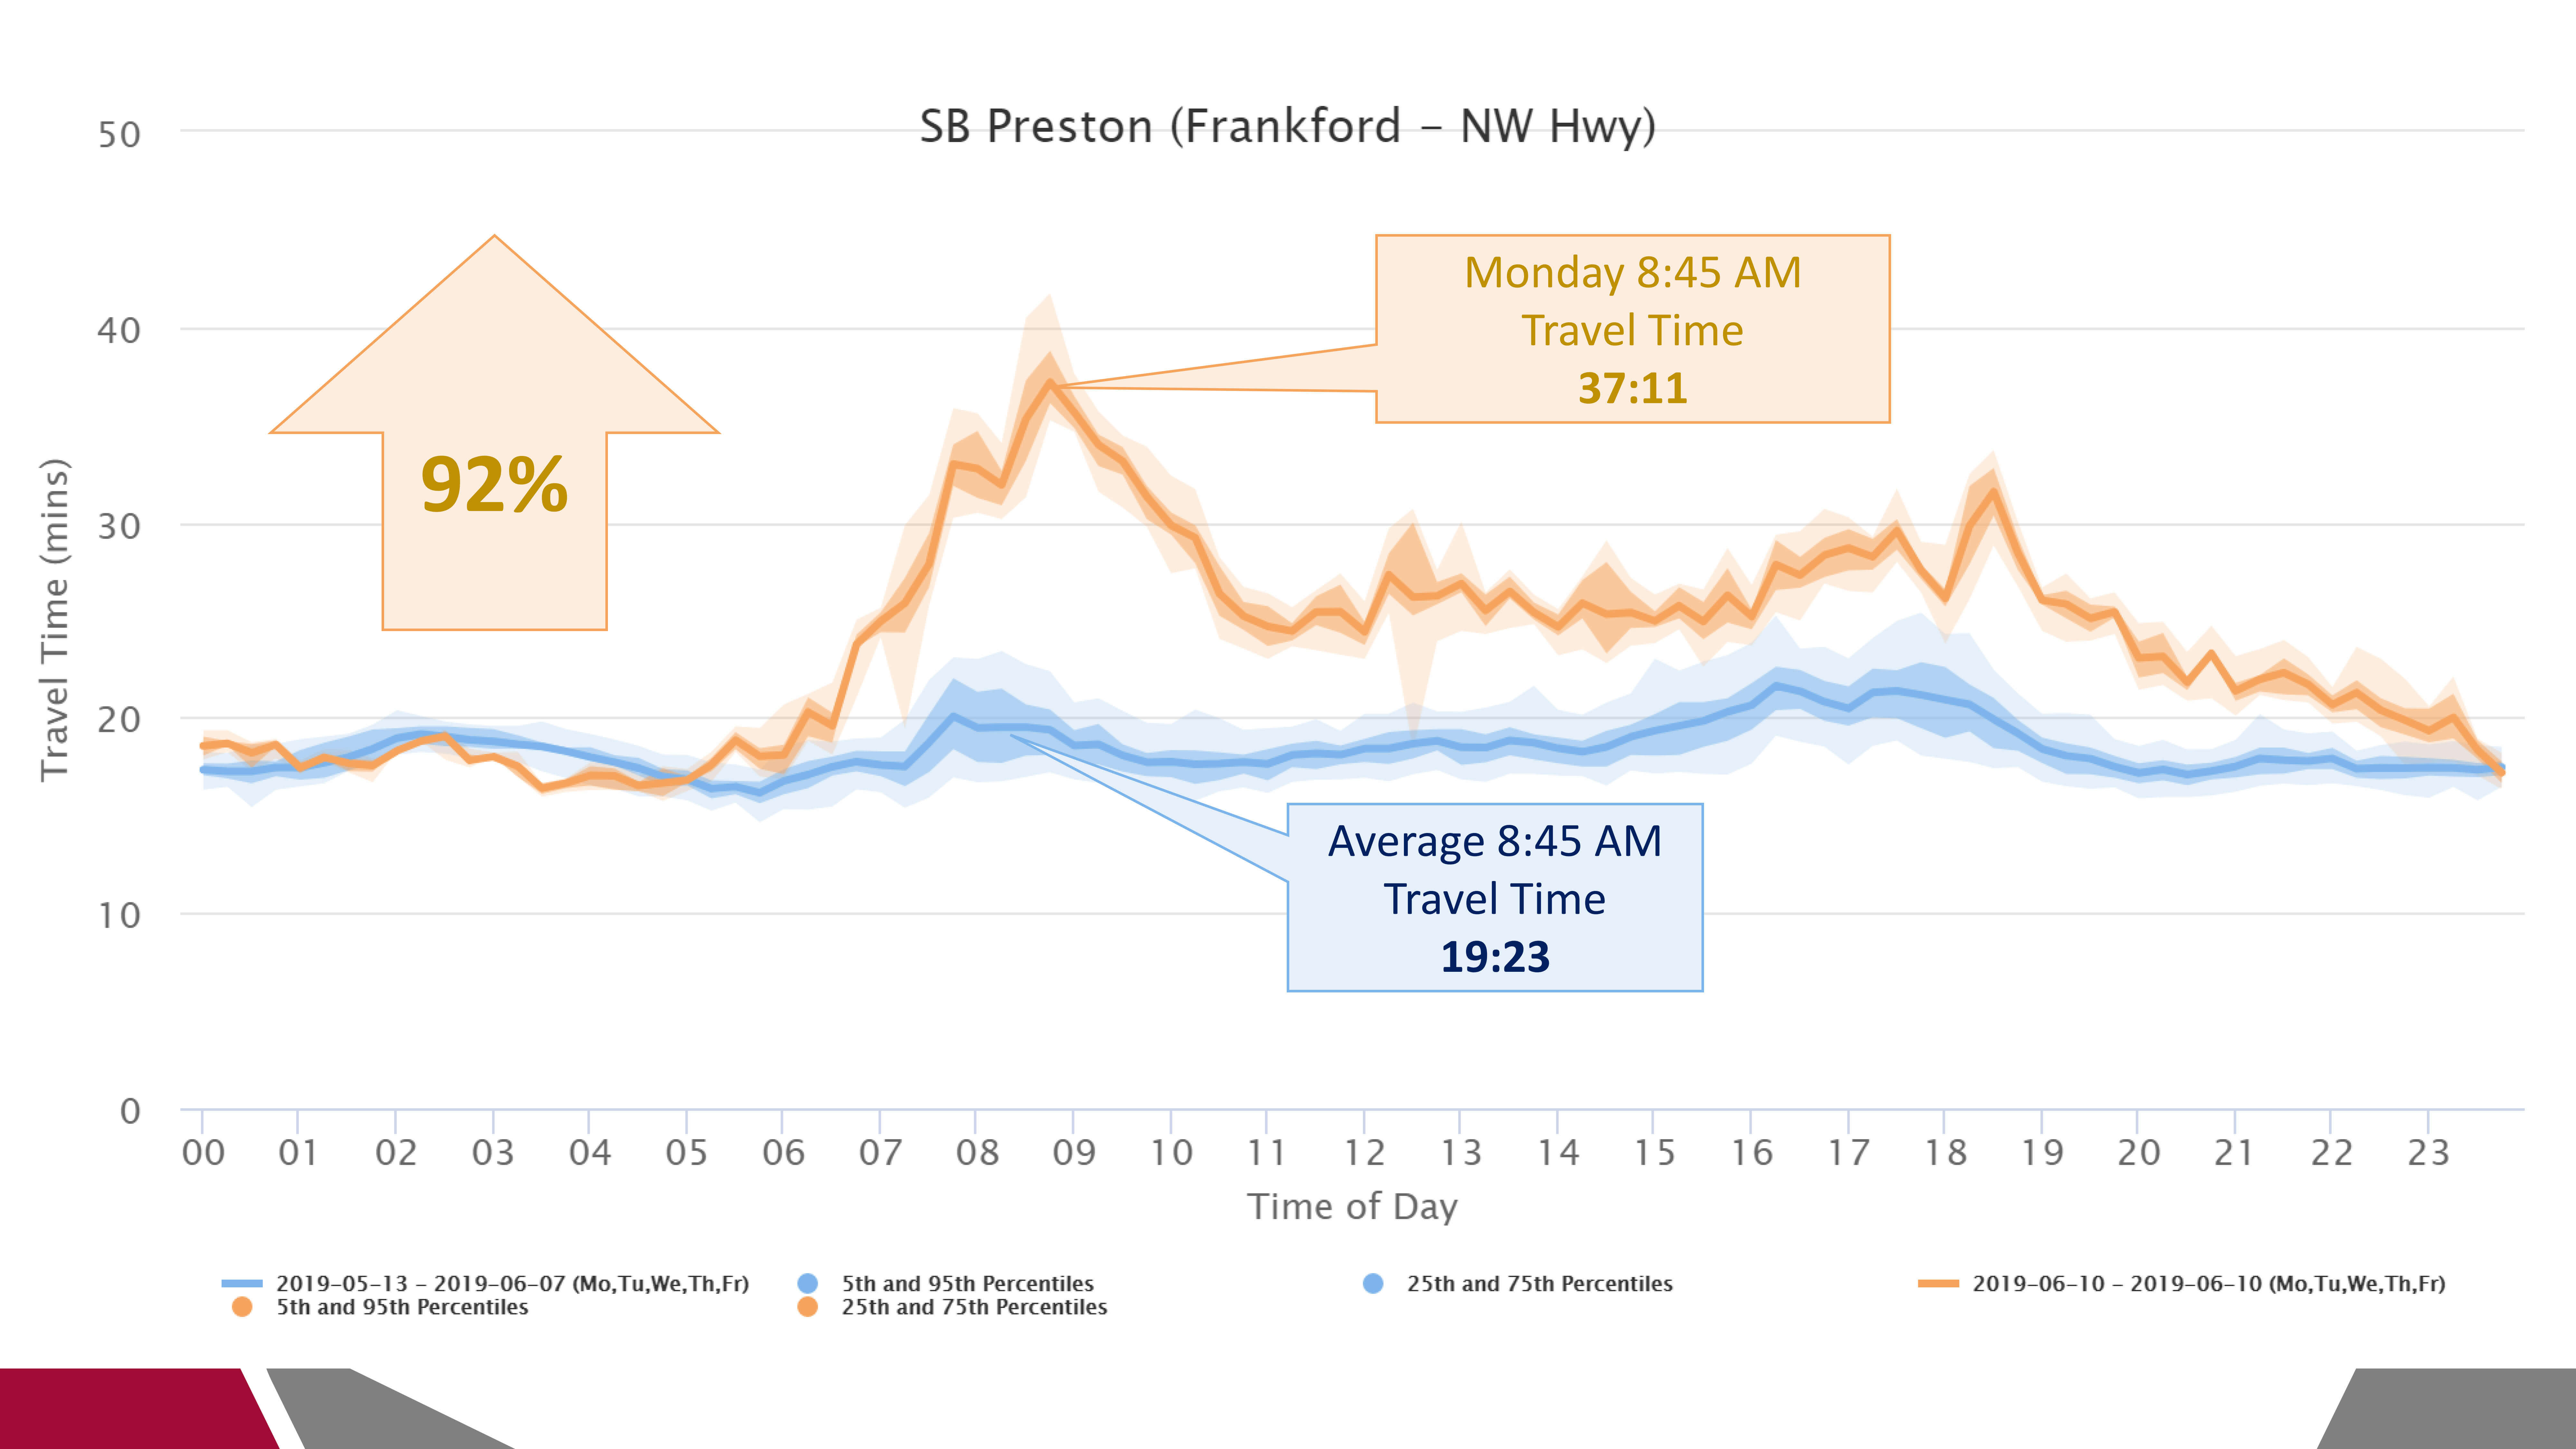
The start and end of the travel route were marked, the travel time was calculated, and the average historical data for the previous month of weekdays was compared to the sample post-storm commute. Typically, the travel time on the nine-mile section of the Preston Road route through 31 signalized intersections is about 22 minutes. The day after the storm, it took 37 minutes—a 92 percent increase—as seen in Figure 1.
This method of measurement offered the City of Dallas a new way to quantify the level of impact from the storm and the loss of coordinated signal timing. We shared these findings with City of Dallas employees, who saw an opportunity to share the data insights with upper management, executive teams, the public information officer, and the public as a new way to quantify and communicate the delays and the level of difficulty required to carry out the storm cleanup work ahead.
The Impact
In the aftermath of the storm, City employees worked around the clock to get more than 600 signals throughout the City back online and running coordinated signal timing.
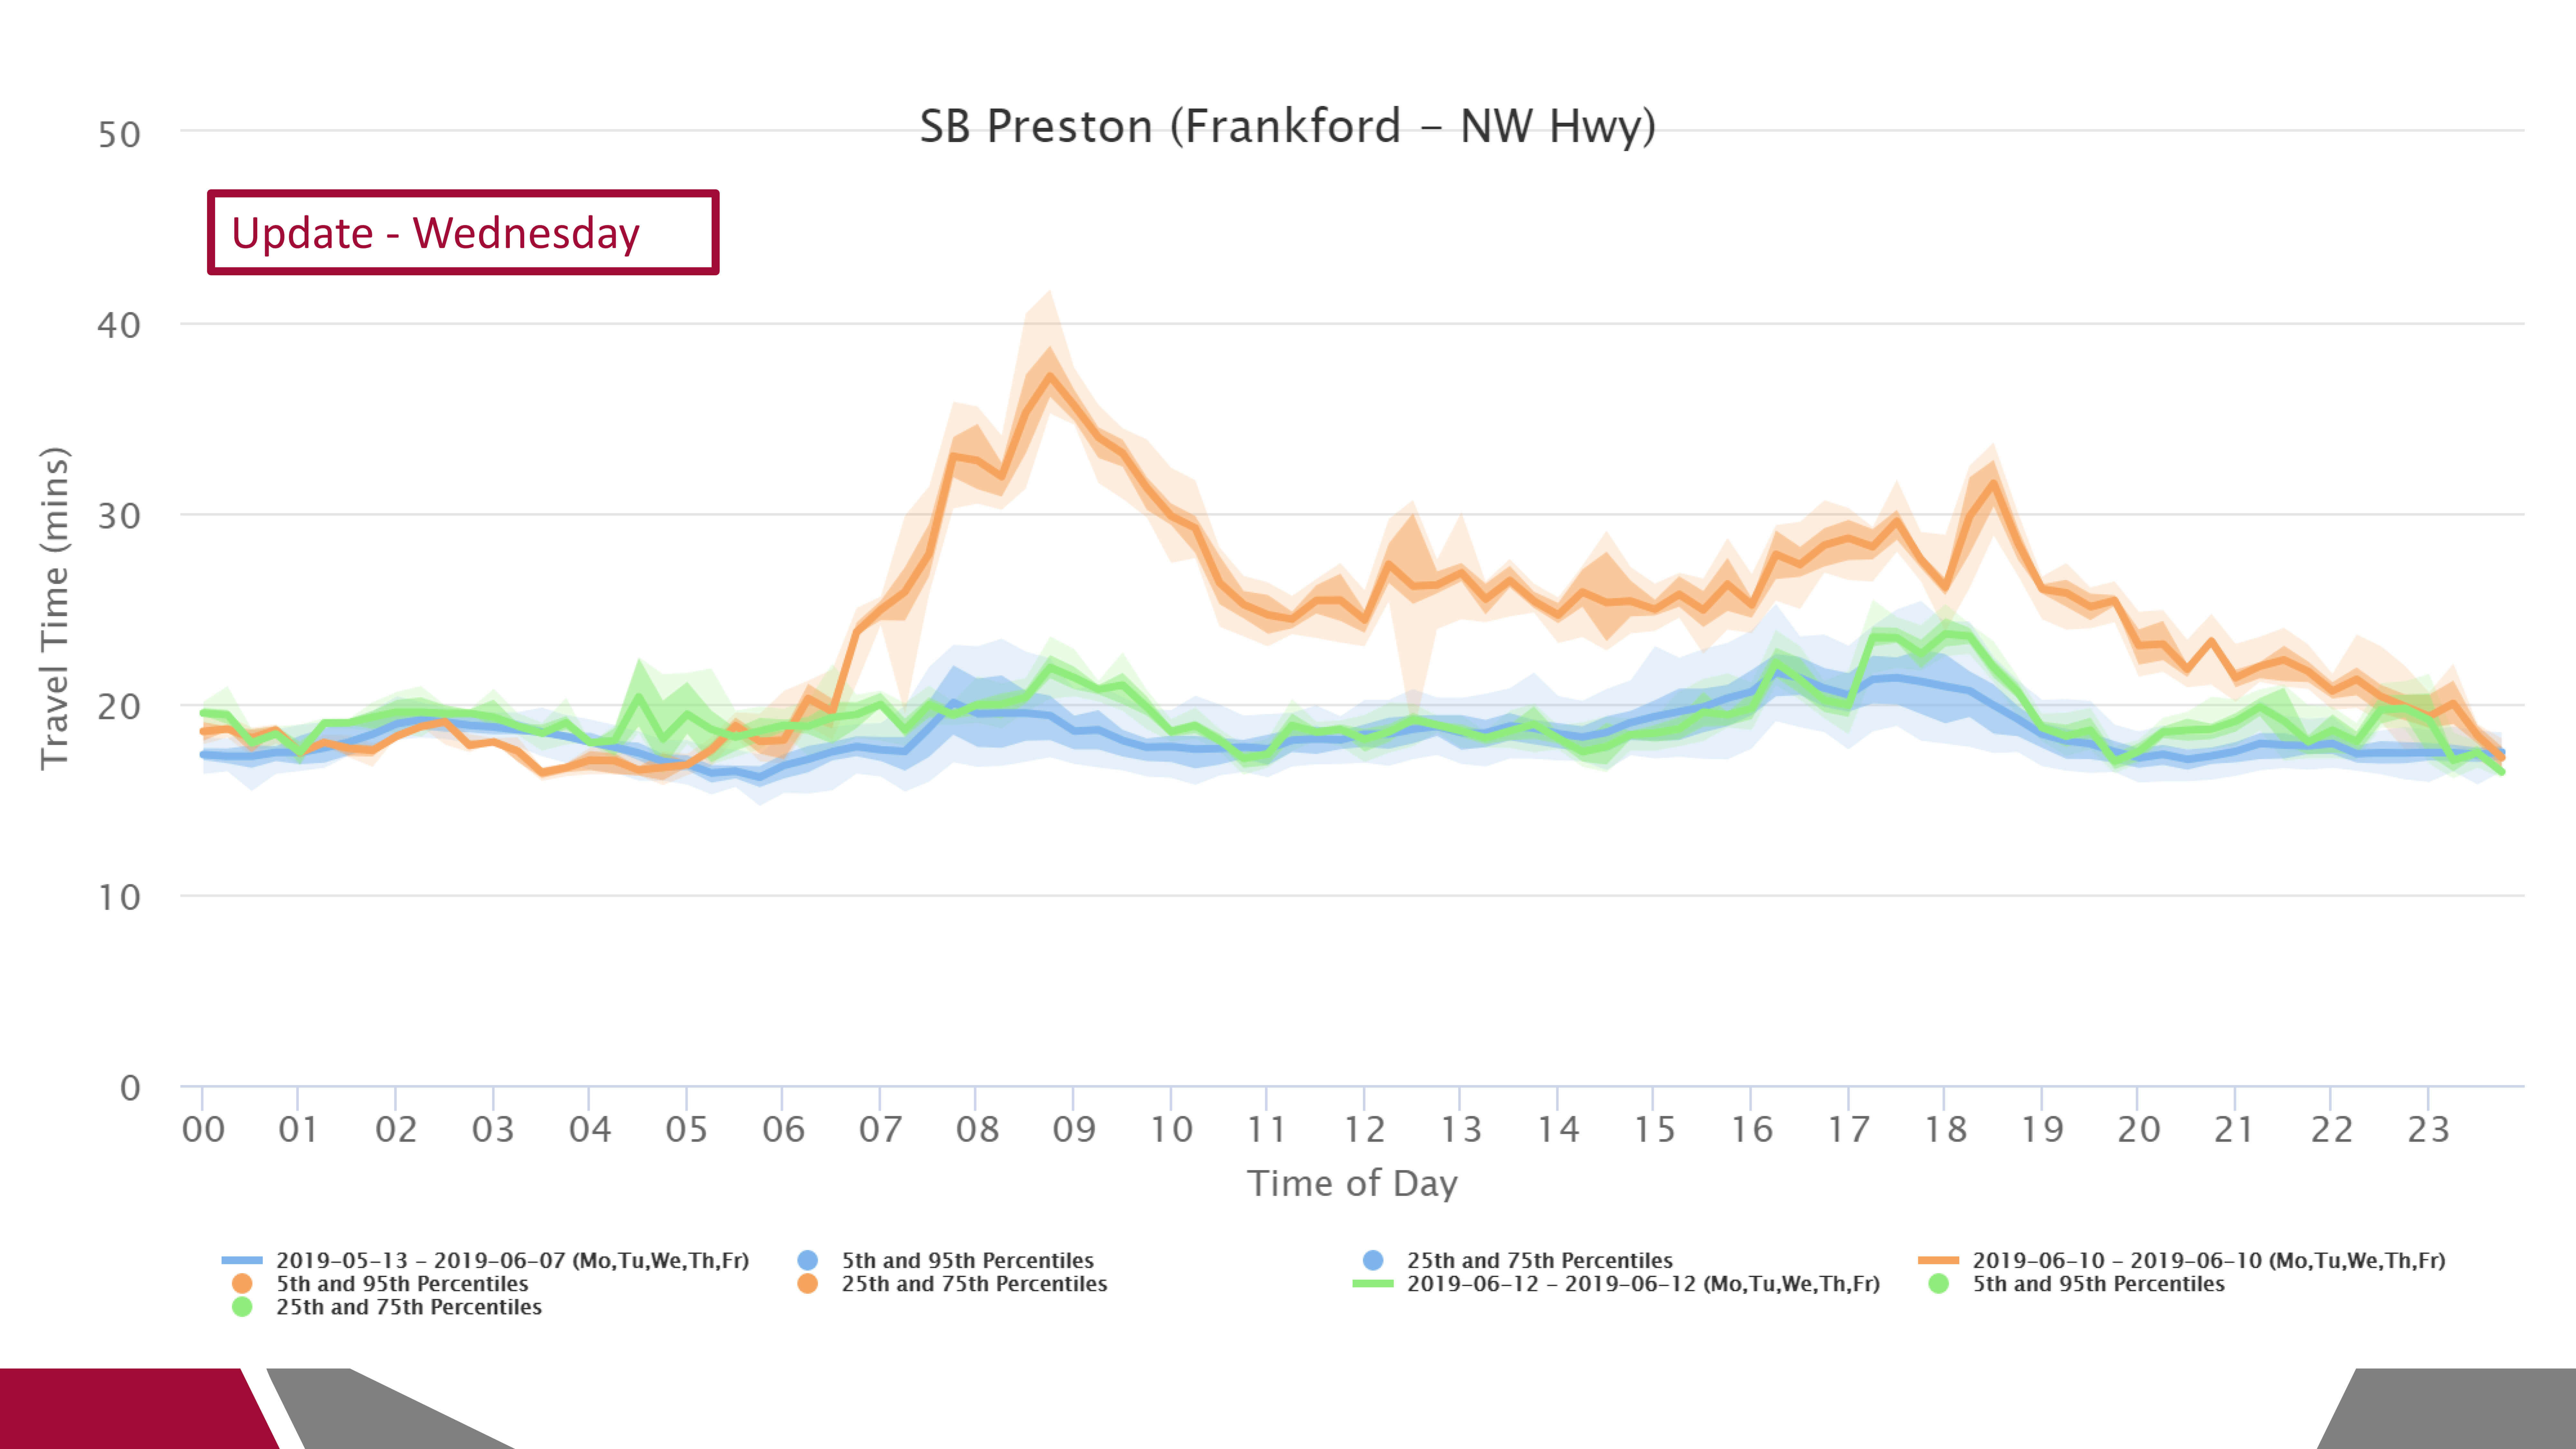
Just two days after the storm, the data on Preston Road showed incredible progress: travel times had improved. Three days after the storm (as indicated by the green line in Figure 2), the signal data proved teams had completed the Herculean task of repairing the signals, returning travel times to normal.
To mark the incident as fully resolved, we ran the same scenario over the same period on a wider scale, which demonstrated that signals were working, and traffic was back to normal by the end of the week.
We were proud to be able to support the City of Dallas through this difficult and unpredictable event by leveraging traffic data analysis to quantify impact and guide the team through a rapid decision-making process. For more information on our Transportation Solutions, please contact our Software Specialists.


