As summer temperatures rise above 100 degrees in Phoenix, nearby Sedona receives its fair share of weekend visitors looking to escape the heat. This influx of visitors traveling by vehicle causes congestion and lengthy travel times throughout the City.
With a desire to better understand and respond to the congestion, the City of Sedona needed to monitor real-time congestion and travel time information on the primary corridors. To gather this real-time data, monitor areas of greatest concern, and implement performance-based solutions, the City worked with its long-time Kimley-Horn partner, Brent Crowther, PE, PTOE, RSP1, along with software specialist, Jason Castillo, to implement Traction™: A Kimley-Horn Software Solution to monitor the travel time and congestion on Sedona’s roadways.
Case Study: Tourist Traffic in Sedona, Arizona
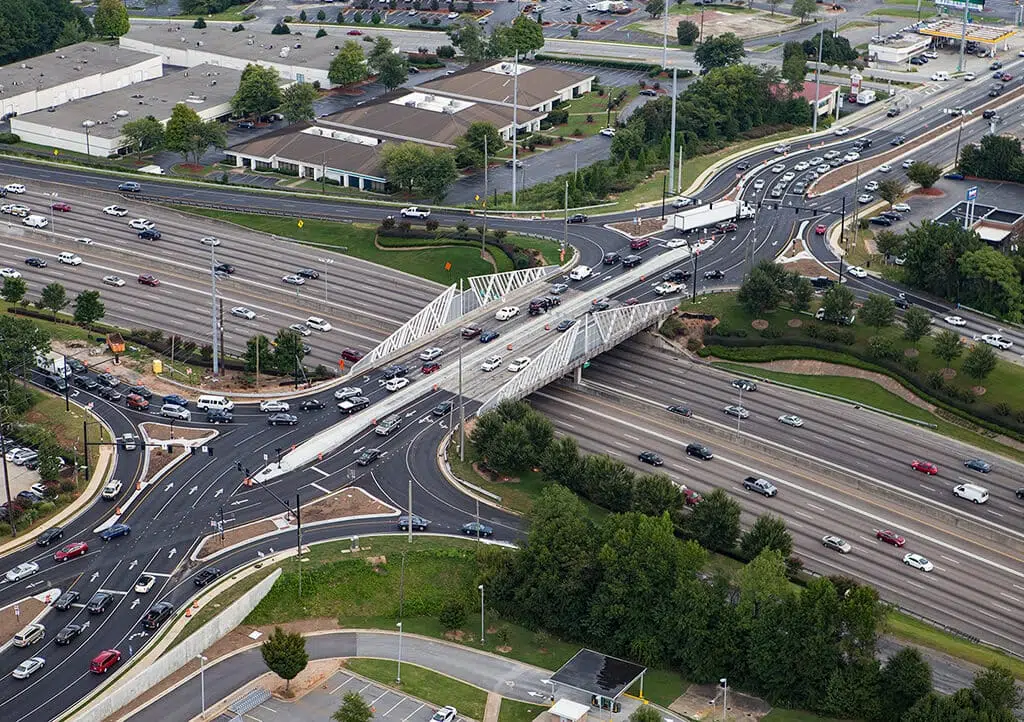
Sedona is a small city in Northern Arizona that sees extensive seasonal travelers, especially in the months of March through October. Known as an outdoor mecca, it is comprised of glorious red rocks and beautiful sightseeing hotspots like Oak Creek Canyon. Sedona is accessed by two state highways: SR 179 from the south (via I-17) and SR 89A from the east and west. SR 89A continues through Sedona and up Oak Creek Canyon toward Flagstaff. Additionally, there is significant pedestrian and bicycle traffic along the City’s main routes.
As Sedona has continued to become a popular travel destination, complaints from both residents and visitors about long travel times during peak periods (e.g. weekends during tourist high season) increased in number. In response, the City wanted to know the frequency and magnitude of the congestion but lacked the infrastructure to proactively identify and understand congestion events and patterns. When congestion backed up in Oak Creek Canyon and tourists reported waiting 45 minutes to an hour in traffic, the City struggled to identify the occurrence and duration of these events.
Introducing a Software Solution: Traction™
Traction™ is an easy-to-use browser and mobile-based cloud-hosted transportation technology solution that provides transportation performance data to both public- and private-sector clients without the need for additional infrastructure. Traction™ is designed to provide real-time, crowd-sourced travel time data to inform traffic management decisions and assist with transportation congestion improvements.
In addition to aggregating crowd-sourced data, the Traction™ mobile app can be used to collect travel times for user-defined trips (trajectory data). This data, along with crowd-sourced travel times and high-level performance measure indicators, can be accessed from an agency’s Traction™ portal.

Since Traction™ integrates mapping and traffic applications such as Waze, Google Maps, and Tom Tom/Azure to collect travel time data into a centralized system, traffic management center (TMC) operators and city, county, or state Department of Transportation staff can view, monitor, and analyze all system performance data in one place. This helps clients quantify actual travel times and respond to traveler concerns.
While completing the City’s Transportation Master Plan, Kimley-Horn used Traction™ to collect and record travel times during peak tourism season. Traction™ provided data that answered the City’s questions such as:
- How long did it take to drive from Grasshopper Point to Uptown on March 2 at 10:00am?
- How many times in the month of March did travel time for that same trip exceed 30 minutes, when it normally takes just seven minutes?
- What was the travel time on Sunday when our Traffic Control team was in the field?
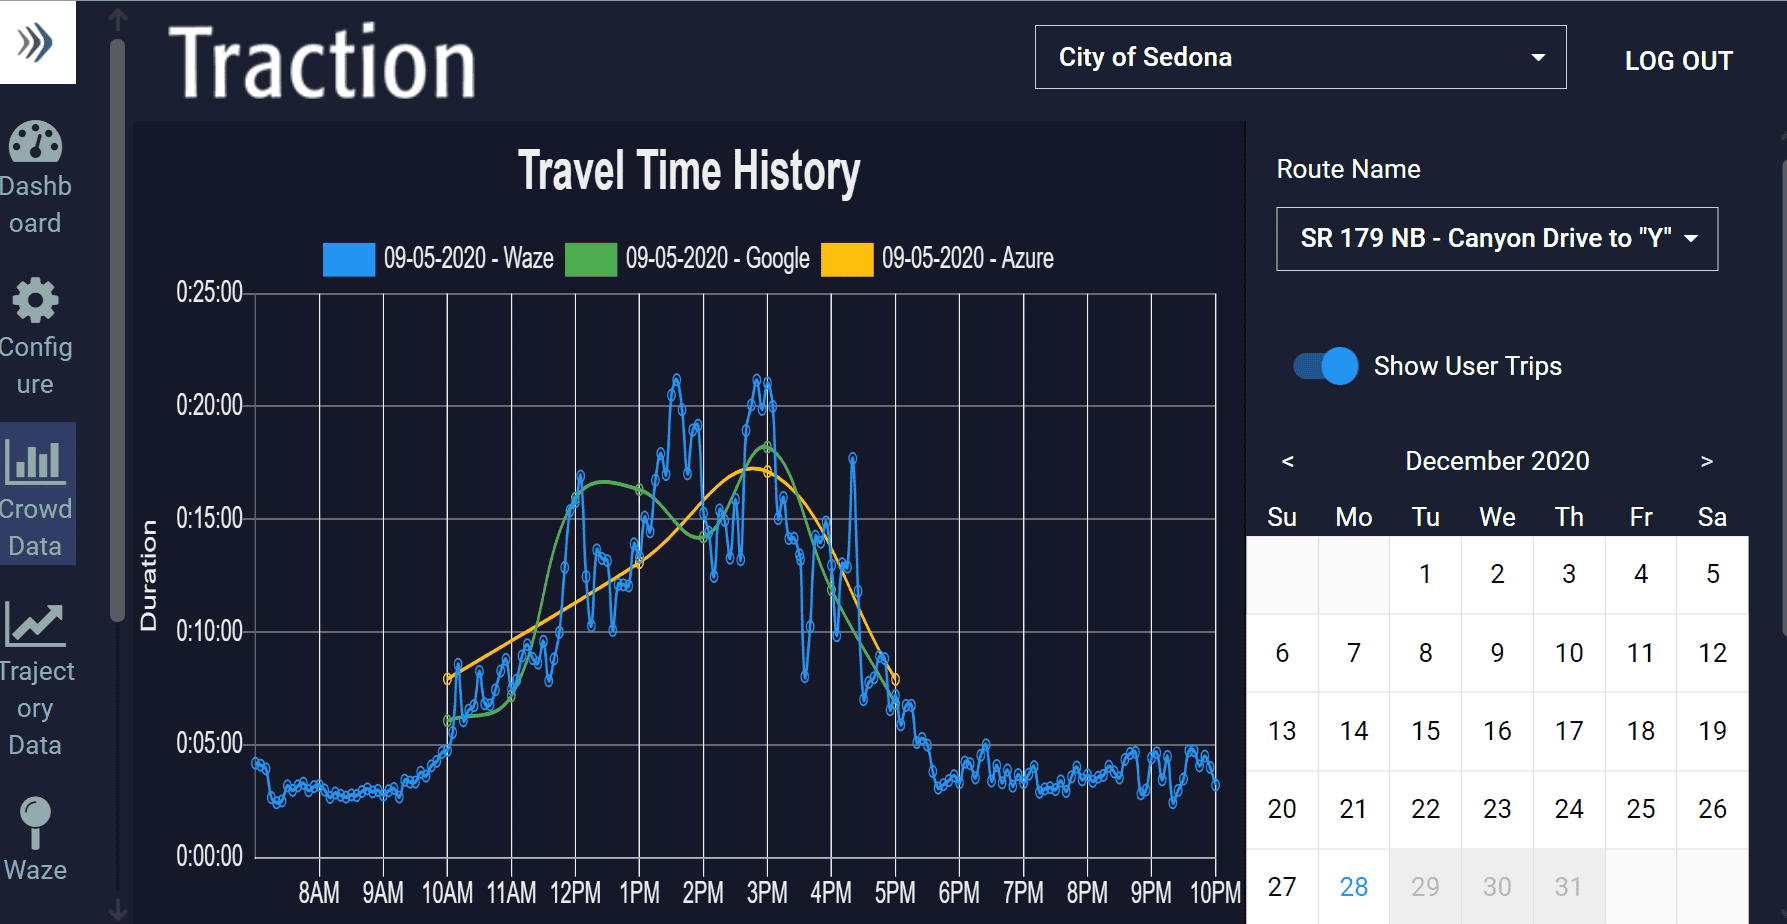
Using this data, the City substantiated travel time claims and identified locations with the most congestion. Traction™ provided the data needed to allow the City to understand how the overall system was performing and validate solutions. Below is a screenshot of travel time information collected on September 5, 2020. The data shows that free-flow travel time for this segment of SR 179 is under five minutes, while the congested travel time is more than 20 minutes.
Leveraging Crowd-Sourced Travel Data to Prioritize Improvements
The Traction™ travel time data was also used to calibrate the traffic simulation model prepared to test different traffic management solutions. This calibrated simulation model helped the City better develop and evaluate projects and communicate them to the public. Having accurate real-time data provided strong evidence to support a project that may not otherwise move forward.
For example, in the popular Uptown district of Sedona, pedestrians frequently cross the street to access stores and restaurants, and vehicles must pass through the area to access the popular Oak Creek Canyon. Traction™ informed the project team that on a busy weekend it can take an average of 42 minutes to complete this typically seven-minute trip in uncongested conditions. Using this data, Kimley-Horn’s transportation engineers calibrated the simulation model to reflect the real-world condition and tested different traffic management and lane configuration strategies. The model told the team that revising the lane configuration would reduce travel time to 17 minutes on a busy weekend. Following construction of the improvements, that is exactly what happened: it now only took 17 minutes for that same trip.
After the conclusion of the Transportation Master Plan, the City has continued to use Traction™, recognizing the value of real-time travel information. While the City also participated in a trial run of a competitor’s tool, the City quickly decided they preferred Traction™ for its ease of use and access to the data they wanted most. The user-friendly interface is available on any desktop or mobile device through an internet browser, so there is no software to install.
Now, with Traction™, the City of Sedona can continually monitor travel conditions in the City, identify hotspots in near real-time, and quickly deploy resources to mitigate congestion.