How Smart Cities Leverage Traffic Data Visualization for Faster Insight

The City of Austin Mobility Management Center Uses Power BI to Transform Traffic Data into Decisions
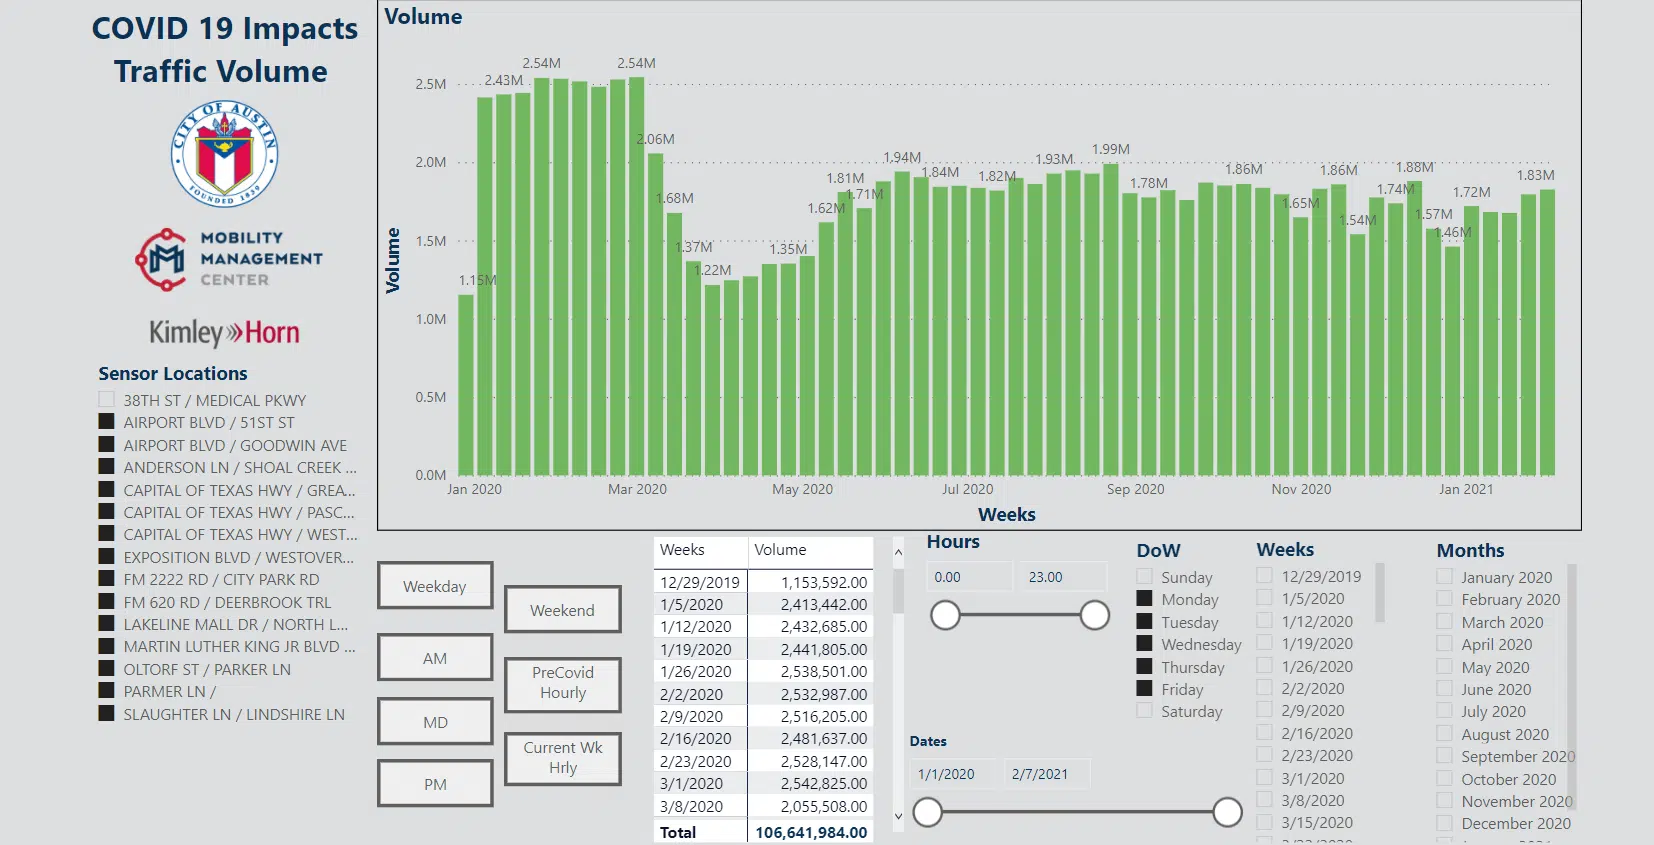
One of the first major changes brought on by the COVID-19 pandemic was a sudden drop in traffic volume as commuters nationwide shifted to working from home. To keep things moving smoothly, the City of Austin wanted to gain a better understanding of traffic data through its Mobility Management Center (MMC), which Kimley-Horn supports through transportation systems management and operations consulting.
Kimley-Horn was asked to provide weekly traffic data reports to demonstrate the impact of the pandemic. The process for translating huge quantities of data into comprehensible reports from various travel time data sources including Traction, INRIX, and the City’s traffic probes, was time consuming. It often took days to produce a single report. Our team was tenacious and successfully introduced the City to a more efficient way of analyzing traffic data through traffic data visualization. Due to the City’s existing procedures for publishing information through its data portal, we used the Power BI data visualization tool to efficiently create the weekly reports, helping the City ensure no changing condition would go unnoticed.
Selecting a System: Using Power BI for Traffic Data Visualization Reporting
Power BI is most commonly used for revenue tracking, sales, and key performance indicators, but is also effective for analyzing any large data set. With Power BI, we sifted through the City’s data, populating a customized dashboard for the MMC that made relevant variables and aggregated information available within a singular dashboard view. Now, instead of taking days to create a report, traffic impact could be visualized and understood in under 30 minutes.
Creating a custom data dashboard showing both the broad traffic trends in Austin as well as data from each major arterial allowed the MMC to access succinct traffic performance data in real-time—a task that previously would have required the comparison of 75 different graphs.
Understanding Trends: Traffic Data Dashboards Drive Decisions
The COVID-19 traffic dashboard allowed the city to make data-driven decisions including modifying lanes for food delivery services, or closing off streets as part of its Healthy Streets initiative. This was possible because the traffic data dashboard clearly conveyed that these changes would not impede traffic flow like they would if traffic were back to normal, high levels.
After confirming the Power BI reports clearly illustrated the reduction in traffic, the City was able to expand construction hours. Instead of a contractor needing to be in the roadway for two weeks, they could now complete work in just four days.
The City was interested in other ways to leverage its existing data and put the insights to action with the reports produced from Power BI. From a desire to show a larger swath of the City’s traffic, the Kimley-Horn team developed an additional dashboard to visualize trends over time. Now, we can look at week-by-week trends that automatically refresh in the report every night. We’re developing more of these system-wide or corridor-based reports to pull out trends from huge data sets that we couldn’t access in the past because of the vast amounts of data in the system.
Identifying Issues: Power BI Brings Traffic Changes to Light
This kind of transformative data has brought some issues to light that would have otherwise been hard to detect. As the Kimley-Horn team adjusted signal operations based on large changes in traffic around the City due to COVID-19, we noticed areas and potential traffic delays that we wouldn’t have observed with traffic cameras and real-time traffic alerts. These reports allowed us to see travel times across all of our critical corridors each week and what changes needed to be addressed.
Recently, the MMC returned a number of arterials back to their normal peak signal plans after the dashboard showed increases in travel times and volume. Remote observations have confirmed that traffic is picking back up in different parts of the city and the Power BI dashboards and reports help make the changing conditions evident.
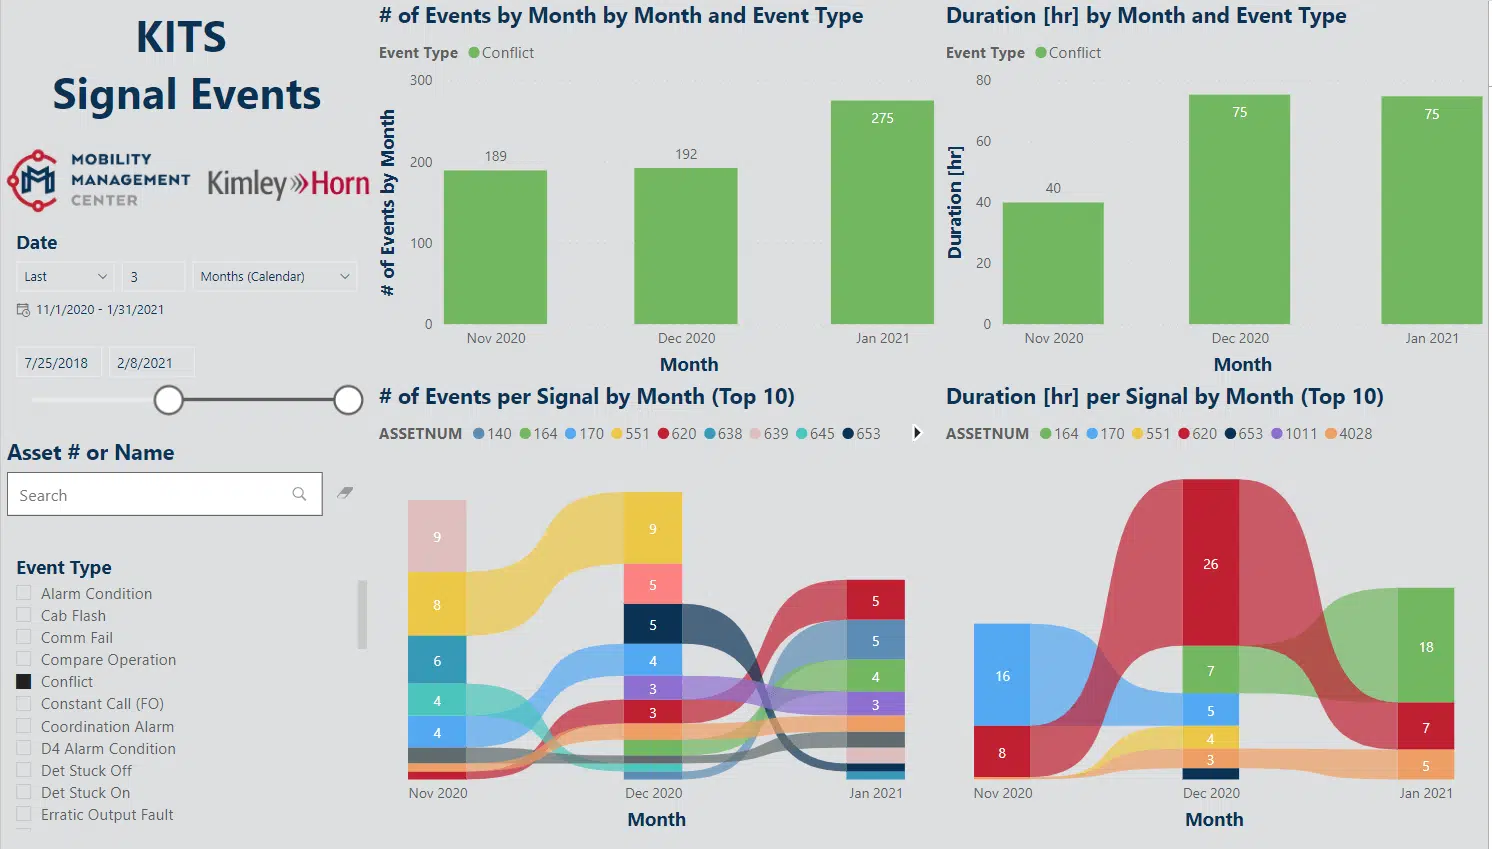
Leveling Up Traffic Insight: Pairing KITS and Power BI
Another dashboard, currently under development, will query the data collected by Kimley-Horn’s Advanced Traffic Management System (KITS) to provide a weekly view of historical trends in the signals in the City of Austin. While KITS is useful for real-time status updates, pairing it with Power BI allows reviewing of trends and identifying chronic underlying issues that would otherwise be missed.
Engineers are notorious for their reliance on spreadsheet tools like Microsoft Excel, but custom Power BI dashboards are an intuitive and visual way to quickly understand areas of concern and make data-driven decisions. Kimley-Horn is helping lead the cutting-edge push to incorporate data visualization into engineering decisions. By leveraging our traffic management expertise combined with additional resources and bandwidth, we saved the City of Austin time and money.

Related Insights