- July 8, 2020
- Perspectives
Time is Money: How ATSPM Data Helps Transportation Agencies Cut Costs
DOTs Use Automated Traffic Signal Performance Measures (ATSPMs) to Improve Efficiency


Anthony Gallo, PE
Transportation Data Scientist

Alan Toppen, PE
VP of Data Analytics
Since 2017, the Georgia Department of Transportation (GDOT), with help from Kimley-Horn partners Alan Toppen, PE, Mark Wood, Anthony Gallo, PE, Kenn Fink, PE, David Craft, PE, and others, have led the nation in the development of tools utilizing automated traffic signal performance measures (ATSPMs). These tools improve the ability of engineers and technicians to perform remote troubleshooting and assess traffic signal performance.
What are ATSPMs?
ATSPMs are data collection and analysis tools that employ hardware and software to collect large amounts of data from traffic signal controllers. This data is then analyzed to drive performance-based improvements in traffic signal operations. ATSPMs are a groundbreaking development in traffic engineering that go above and beyond the traditional functionality of traffic signals by providing a continuous record of arterial operations, saving agency staff time on data collection, field visits, and troubleshooting.
Kimley-Horn’s suite of custom web tools for transportation agencies incorporate ATSPMs to assist staff in understanding issues at individual signals as well as understanding corridor-wide, region-wide, and statewide performance in unprecedented detail. Gathering data from over 8,000 traffic signals statewide, these web tools make the GDOT ATSPM system the largest in the nation by a factor of more than four.
ATSPMs Detect Issues and Streamline Troubleshooting
ATSPM systems log hundreds of different events in the traffic signal controller—up to every tenth of a second—which can generate approximately 10 megabytes of data per day per signal. Each of these events is coded in a standard format, then analyzed by a web application that calculates a variety of performance measures with helpful visualizations.
GDOT’s engineers and technicians use their web application’s custom data dashboard to pinpoint issues in the controller operation or to identify faulty detectors, allowing them to proactively identify and troubleshoot issues with fewer trips to the field. Some examples of issues identified include:
- What a detector is reporting at a specific signal location over a single day or a few days (e.g. constant calls from vehicles or no calls from vehicles, which could indicate a detector or communication issue)
- Whether a left turn isn’t serving demand during the peak period
- Whether mainline offsets could be improved to achieve more vehicle arrivals on green
Custom ATSPM Dashboards Identify Big-Picture Improvements
Despite its many advantages, the base ATSPM application was not designed to address bigger picture questions, such as:
- How is an entire corridor performing in aggregate over a certain period?
- Are my performance measures improving year-over-year or month-over-month?
- How is one corridor performing compared to another?
- Did a recent timing project improve corridor operations based on corridor travel time or percent arrivals on green?
- Is state-of-good-repair meeting targets?
These are the sorts of questions to which GDOT needed answers. The ATSPM data contained the information needed to find solutions, but GDOT required a different way to visualize this information. Supporting GDOT, Kimley-Horn developed a tool called MARK 1 (Measurement, Accuracy, and Reliability Kit, version 1).
MARK 1: A Custom ATSPM Tool Built For GDOT
MARK 1
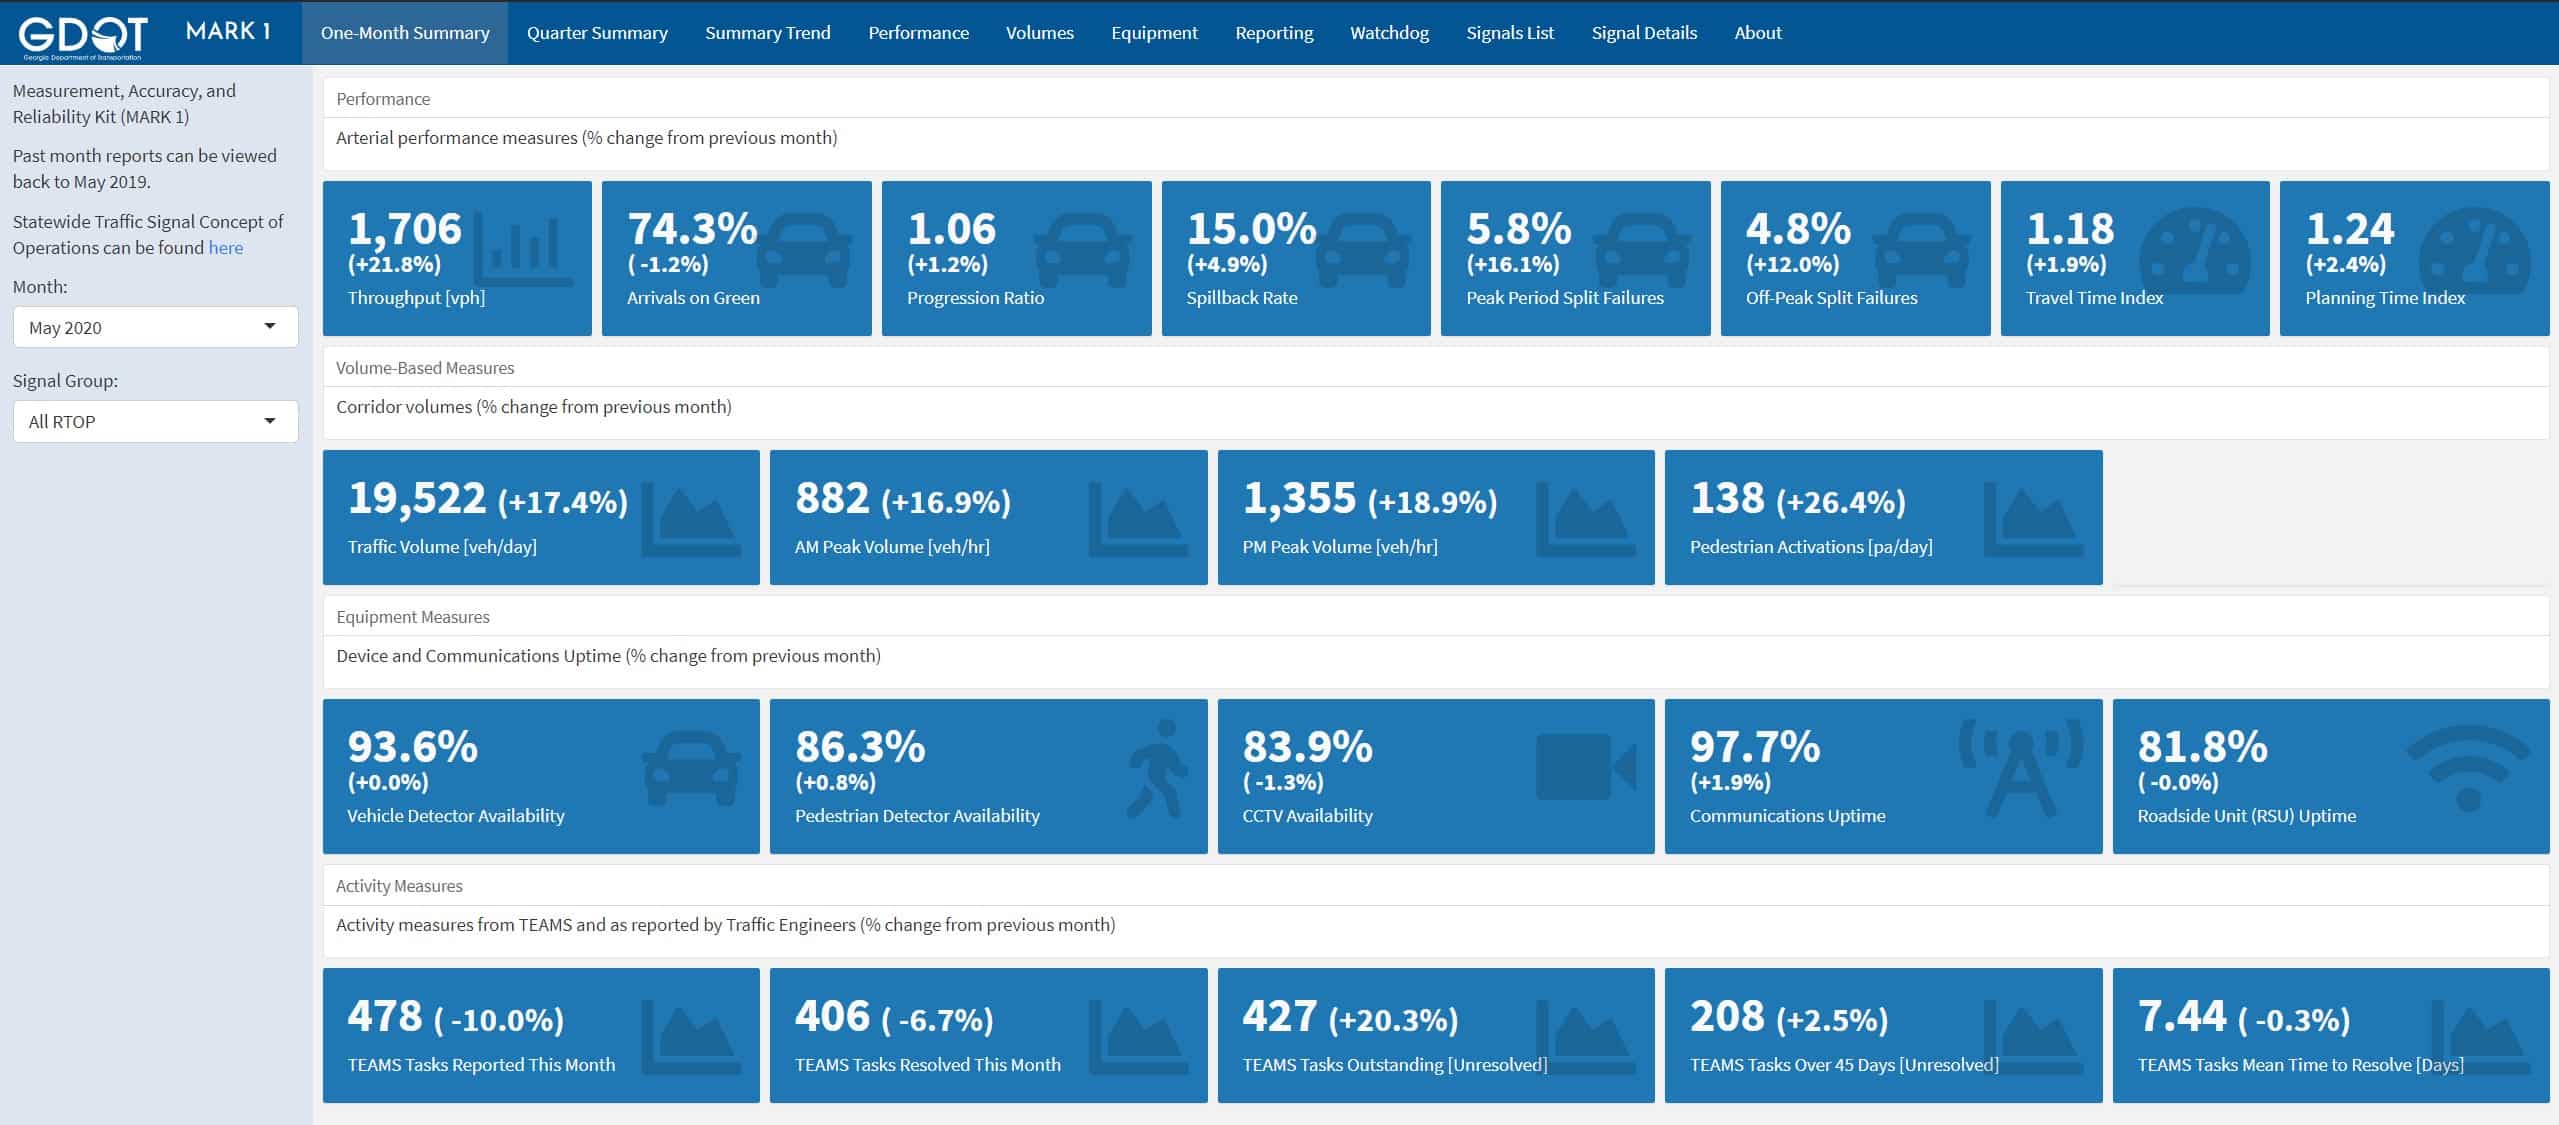
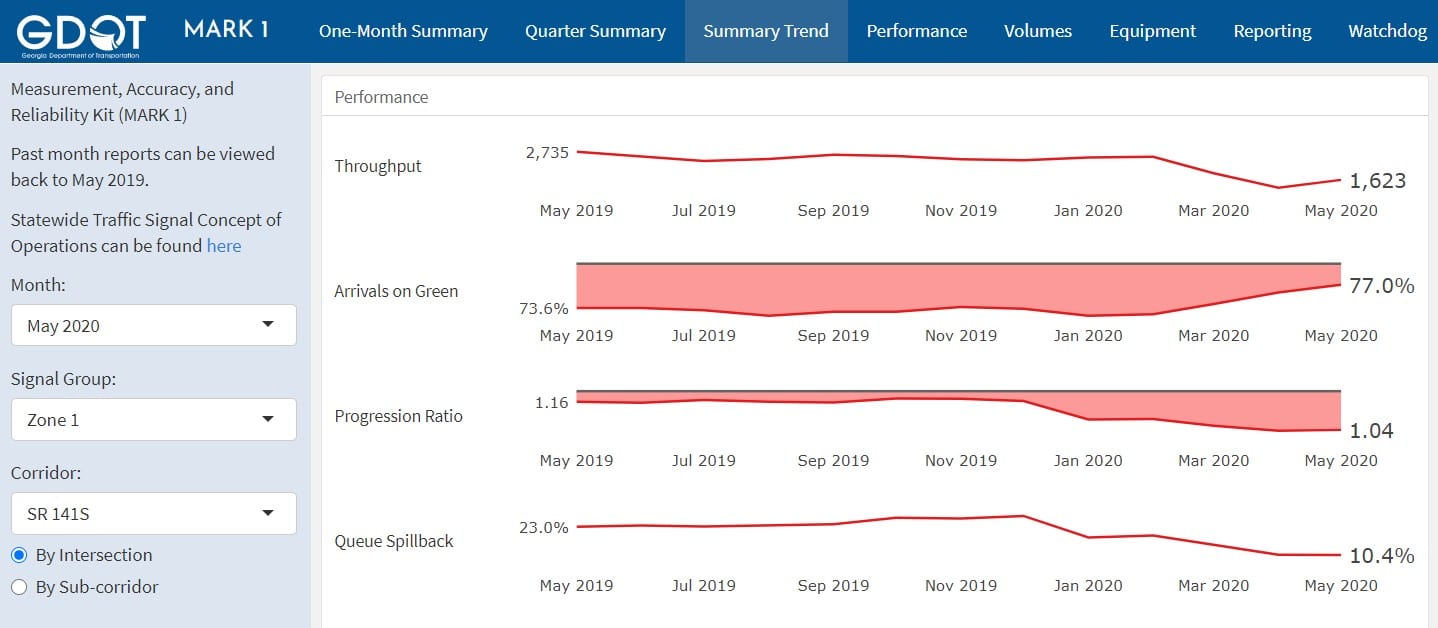
Using open-source technologies, MARK 1 shows many of the same performance measures reported using ATSPMs, but at a scale that reveals trends and comparisons over a year or longer. Like other ATSPM systems, MARK 1 is a public-facing web application designed for all user levels. It has high-level (quarterly or monthly) reports, as well as more detailed corridor-level and signal-level views that are used by a variety of staff who manage GDOT’s corridor operations or higher-level users who manage these programs.
One Month Summary View
Summary Trend View
In addition, MARK 1 also tracks elements of interest to GDOT that are not part of standard ATSPM systems including:
- Closed-circuit television (CCTV) cameras and roadside unit (RSU) uptime
- CCTV and RSU repair tickets (such as mean time to repair and tickets over 45 days outstanding)
- Corridor travel times and travel time reliability using HERE data
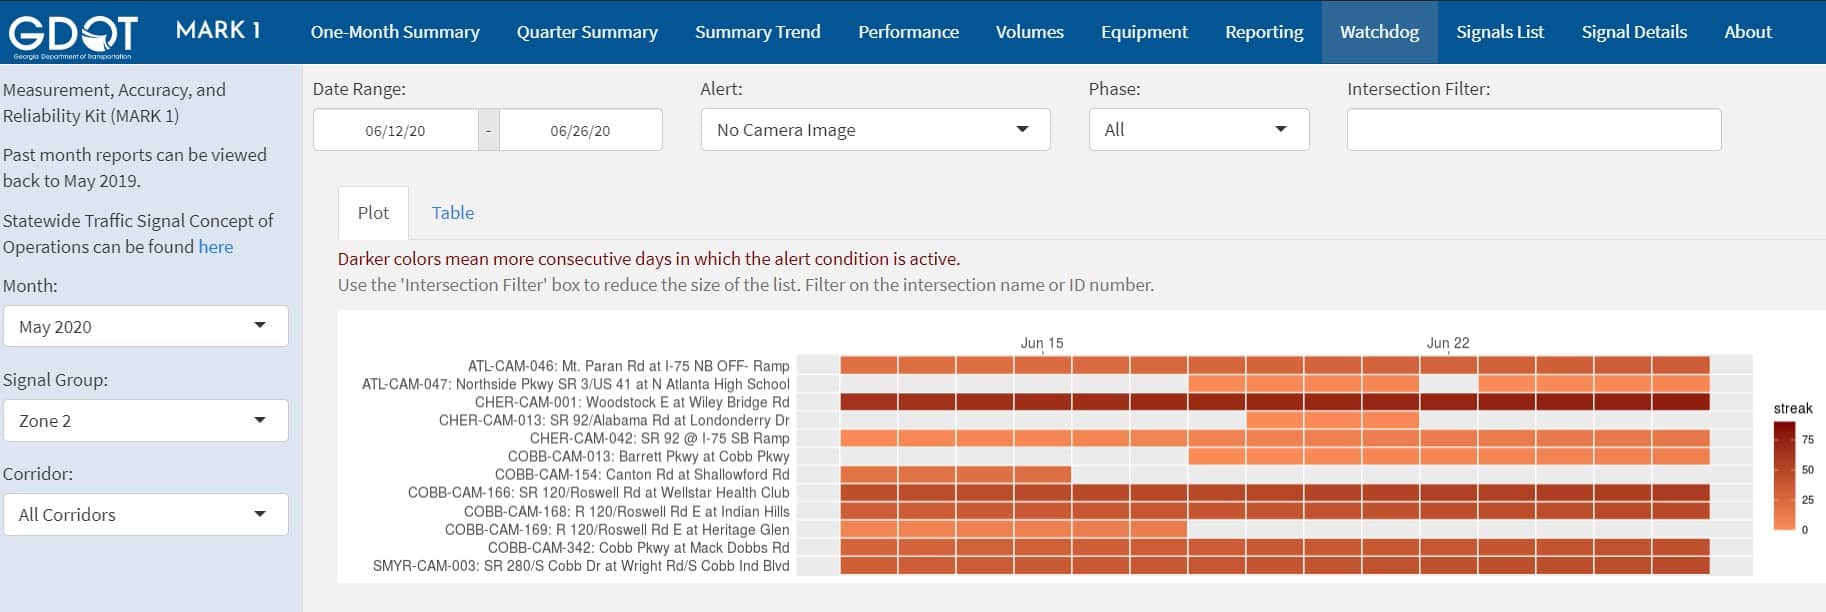
While much of MARK 1 is concerned with performance trends, one of the most-used components is the Watchdog, which enhances a feature in the base ATSPM application. The Watchdog scans the event data nightly for anomalies and reports them out each morning. MARK 1 takes the default ATSPM reporting metrics, adds additional items, and packages them up in tabular and graphical forms to show what issues are current and how long they have been active.
The custom features we built into MARK1 help staff scan for issues each day and understand whether issues have been addressed. As detector data drives much of the performance measures, and because detector health is so important for effective operations, detector uptimes are a well-used Watchdog measure. MARK1 uses a combination of ATSPM filters and its own to flag detectors that have suspect or outright unreliable data and displays this in the Watchdog.
Watchdog Alert for CCTV Downtime
Where to Next?
Kimley-Horn is currently assisting GDOT with implementing Corridor Health Metrics into its ATSPM dashboard. These metrics will assess signals and corridors according to common characteristics such as urban grid, arterial commuter, and low-volume isolated. Different types of corridors have different performance objectives so we’re tailoring our metrics to what is most important to each corridor.
GDOT has demonstrated leadership throughout the industry with the development of MARK1 and contributed new performance measures and visualizations to the open source ATSPM codebase maintained by Utah DOT. The industry has noticed—GDOT won the 2019 National Operations Center of Excellence: Data Management Award as well as the 2018 ITS Georgia Innovation: Outside the Box Award.
Kimley-Horn is building off the success experienced with the GDOT implementation and is currently assisting clients with ATSPM metrics in Virginia and Texas.
To learn more about custom ATSPM dashboards, contact Alan Toppen or Anthony Gallo.
About the Authors
Anthony Gallo, PE
Anthony has more than 10 years of experience in transportation data science, consulting, and research. His experience covers a range of ITS planning, traffic operations, and transportation planning applications, working on projects around the country using data to share insights. Anthony is passionate about data analytics and visualization and has previous experience in data science beyond the field of transportation prior to joining Kimley-Horn. Anthony has the ability to quickly mine data to spot anomalies and trends and understand the root causes of these insights.
Alan Toppen, PE
Alan has more than 20 years of experience in ITS consulting and research including systems engineering, state/regional ITS planning, traffic signal systems, traveler information systems, performance management, and data analysis/program support. Lately, Alan has been leading efforts in data analytics and the development of interactive data products for clients. Alan has been with Kimley-Horn in Northern Virginia for 15 years, serving clients across the country and internationally. He is beginning his second term on the board of ITS Virginia.
Share This Post
Our Award-Winning Work on MARK 1
2020 National Operations Center of Excellence: TSMO Awards Overall
2019 National Operations Center of Excellence: Data Management Award
2018 ITS Georgia Innovation: Outside the Box Award