Tailoring Traffic Signal Operations to the “New Normal”
How to use traffic data comparisons to inform signal timing during COVID-19
The COVID-19 pandemic and quarantine efforts around the country have created many opportunities to modernize operations, especially when it comes to big data applications.
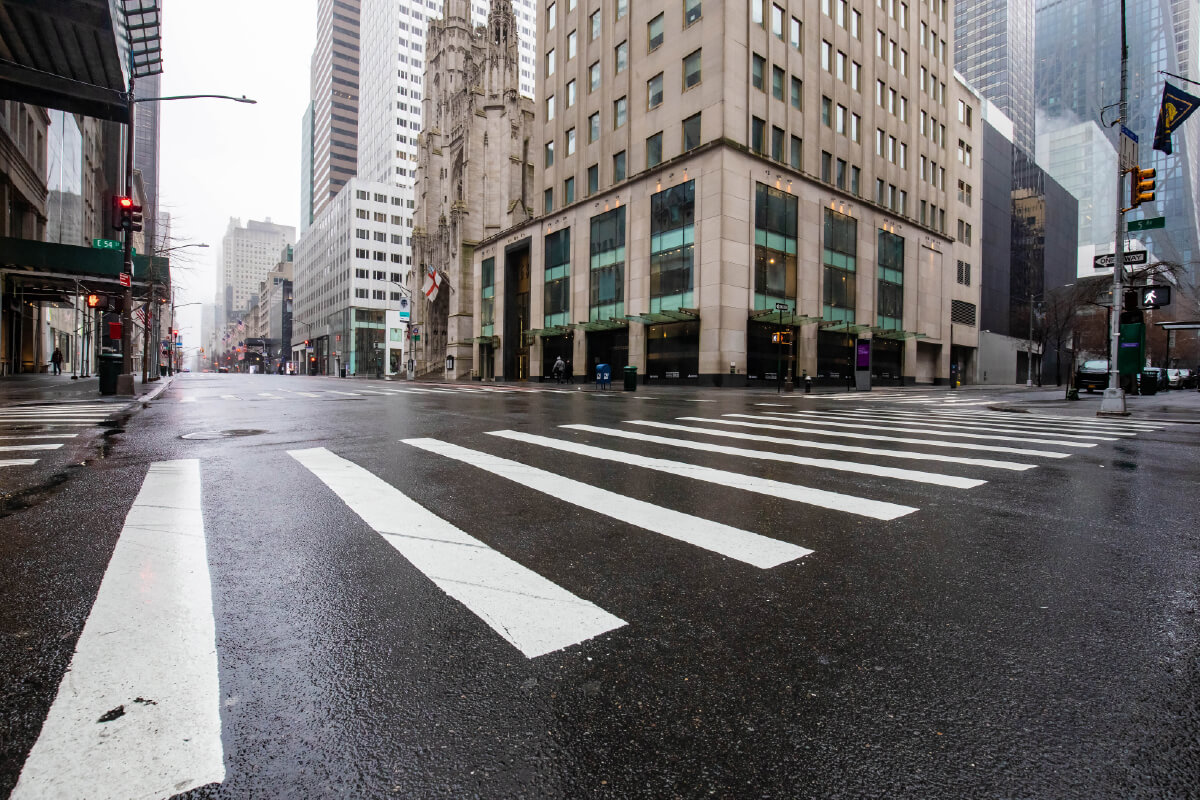
With large segments of the population staying home, traffic patterns have changed dramatically. To keep traffic flowing, municipalities and agencies have switched from their typical time-of-day signal operations designed around heavy, directional commuter traffic to shorter plans designed for lighter, balanced traffic volumes.
Now that stay-at-home orders are tapering off and some businesses are reopening, cities must make new assessments: will traffic return to normal volumes?
Adapt Operations with Quantitative Traffic Data
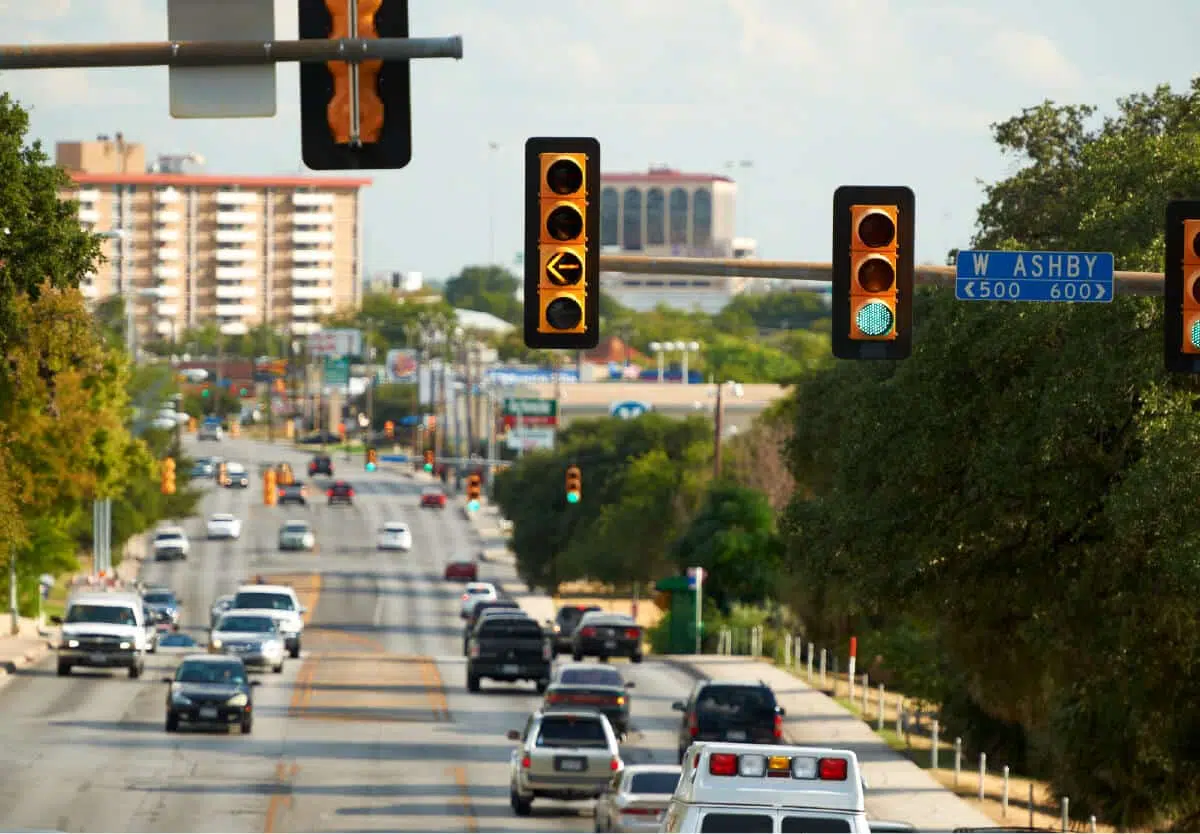
Qualitatively, we can observe increased traffic as businesses start to reopen. However, when making operational decisions, it’s better to use available quantitative traffic data from innovative sources to correctly adapt your operations.
The right approach for your city will depend on the data you have: crowd-sourced data from sources like Traction, INRIX, or StreetLight Data; or collected data, such as tube counts or turn counts. With crowd-sourced data, you can compare current metrics (i.e. travel times, VMT, delay, speed) to historical data. We recommend using data collected in October or February as a benchmark to evaluate the “new normal.” If your city has collected data from annual count programs or recent projects, consider setting up new counts in the same intersections to compare against your prior data.
With either crowd-sourced or collected data, you need to establish a baseline and then select a tipping point for what you will consider “normal” traffic.
Reset Signal Timing by Comparing Current Traffic Data to Historical Data
To understand any changes in traffic, you’ll first need to compare your data with historical data. In many cases, we are seeing a 40 to 60 percent drop in traffic. Identify this low to use as a comparison as businesses reopen.
Then, your agency must decide what “normal” or at least “new normal” will look like. For instance, if your city saw a 60 percent drop in traffic, you may decide to return signals to normal operation when traffic rebounds to 80 percent of your historical data. With schools in some areas closed for the remainder of the year, the “new normal” may look more like summer traffic than a typical traffic flow.
You can also consider the current traffic delay. If you are operating your mid-day signal cycles and begin to see long delays even with only 75 percent of traffic, it may be time to switch to normal cycles or work with a traffic engineer to establish “new normal” cycles—signals that are shorter than mid-day but longer than rush hour.
By reviewing your available traffic data and making comparisons to historical trends, you can make data-driven decisions to keep traffic flowing while maintaining safety.

Related Insights